Introduction: Predictive Analytics is a fascinating branch of Data Science that focuses on using historical data to predict future outcomes. By analyzing trends and patterns, predictive models provide valuable insights that help businesses, governments, and individuals make better decisions. In this post, we’ll explore the power of predictive analytics, its real-world applications, and how it’s transforming industries.
1. What is Predictive Analytics?
Predictive Analytics uses statistics, machine learning, and data mining techniques to predict future events. The process involves analyzing past data to forecast potential trends, risks, or opportunities.
How it Works:
- Data Collection: Historical data is gathered from various sources like sales records, website interactions, or weather patterns.
- Model Building: Algorithms are trained on this data to identify patterns and make predictions.
- Prediction: The trained model provides forecasts based on new or unseen data.
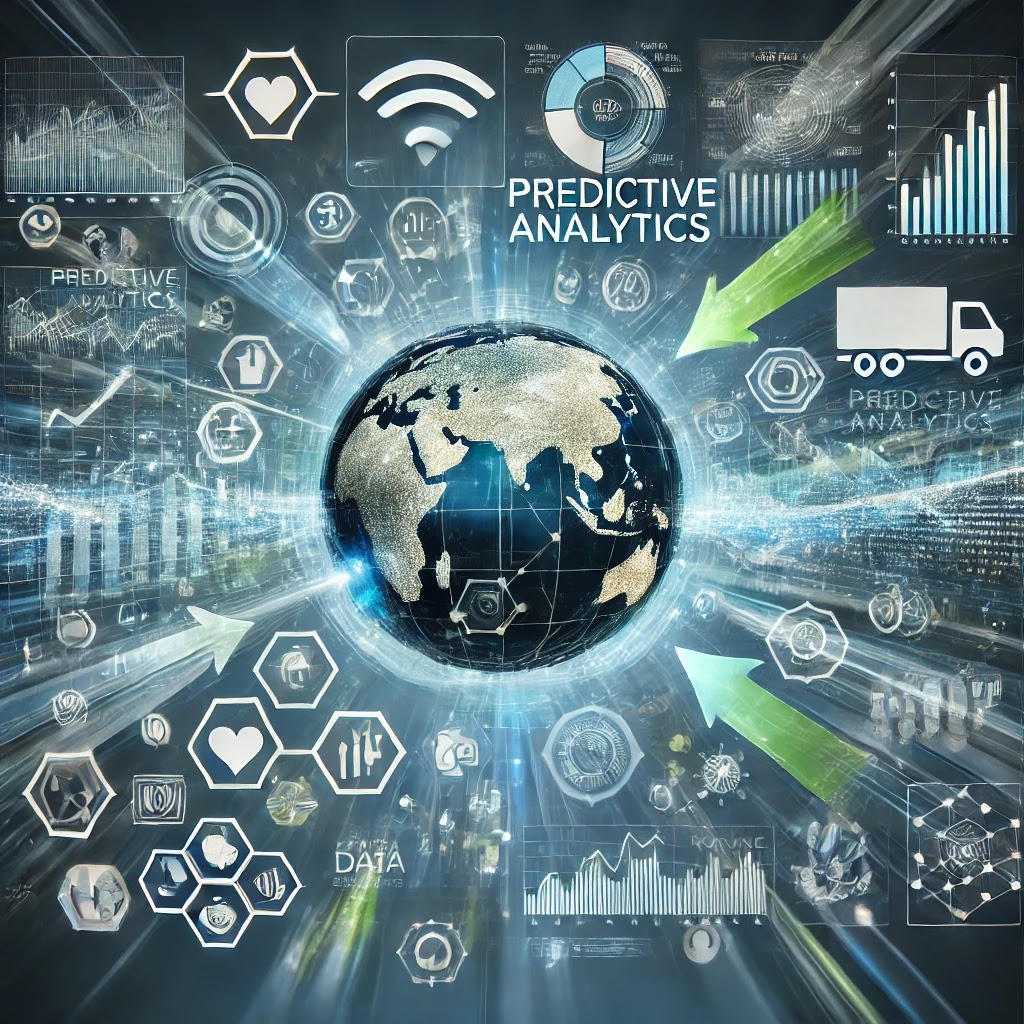
2. Applications of Predictive Analytics
Healthcare
In healthcare, predictive analytics helps identify patients at risk for certain diseases or health conditions. This allows for early intervention and preventive care, potentially saving lives.
Example:
- Hospitals use predictive models to forecast patient readmissions and optimize treatment plans based on historical patient data.
Marketing and Sales
Predictive analytics helps companies anticipate customer needs and preferences, allowing them to target the right audience with personalized marketing efforts.
Example:
- Retailers use predictive models to determine the likelihood of a customer purchasing a product, improving customer engagement through personalized offers.
Finance
In the finance industry, predictive analytics is essential for risk management, fraud detection, and investment strategies. By analyzing past financial transactions, predictive models can alert companies to suspicious activities or investment opportunities.
Example:
- Banks use predictive models to detect fraudulent transactions in real-time, protecting both customers and the institution.
Supply Chain and Logistics
Predictive analytics is critical in managing supply chains by predicting demand, optimizing inventory, and minimizing delivery delays.
Example:
- Shipping companies use predictive models to forecast delays and adjust delivery routes, improving efficiency and customer satisfaction.
3. The Technology Behind Predictive Analytics
Predictive analytics relies on a combination of technologies and techniques, including:
- Machine Learning Algorithms: These help in building models that learn from past data and improve their accuracy over time.
- Big Data: The vast amount of data generated daily is used to enhance the accuracy and reliability of predictions.
- Data Mining: Identifies patterns in large datasets, helping to extract valuable insights.
4. Challenges in Predictive Analytics
While predictive analytics is powerful, it’s not without challenges:
- Data Quality: The accuracy of predictions depends on the quality of data used. Incomplete or inaccurate data can lead to unreliable predictions.
- Model Complexity: Creating accurate models requires understanding both the business problem and the technical side of model building.
- Ethical Concerns: Predictive models must be used responsibly to avoid bias or privacy violations, especially when dealing with sensitive data like healthcare or financial information.
Conclusion:
Predictive Analytics is an essential tool for decision-making in today’s data-driven world. From predicting future sales to identifying health risks, this branch of Data Science has the potential to transform industries by offering actionable insights based on data. As technology continues to evolve, the applications of predictive analytics will only grow, empowering organizations to make smarter, more informed decisions.
Predictive analytics isn't just about looking into the future—it's about shaping it. By leveraging historical data and advanced models, businesses and individuals can anticipate outcomes and navigate uncertainty with confidence.
Comments
Post a Comment